conferences
ArcGIS API for JavaScript: 2D Visualization
length: 60 min
presenters: Kristian Ekenes, Jeremy Bartley
Mar. 11, 2020 2:30 p.m. - 3:30 p.m. Prerecorded and presented on YouTube.
Palm Springs Convention Center, Catalina/Madera
Summary
The ArcGIS API for JavaScript lets you build powerful interactive mapping applications. Learn how you can turn your raw data into information that tells a story with simple 2D data-driven visualizations. This session will provide an overview to the various visualization techniques available in the API specific to 2D vector data.
Presentation
Watch the video presentation.

Slides
Demos
Visual Variables - Political Leanings
The following series of apps displays the same data multiple ways using visual variables.
This app renders outlines with no data values.
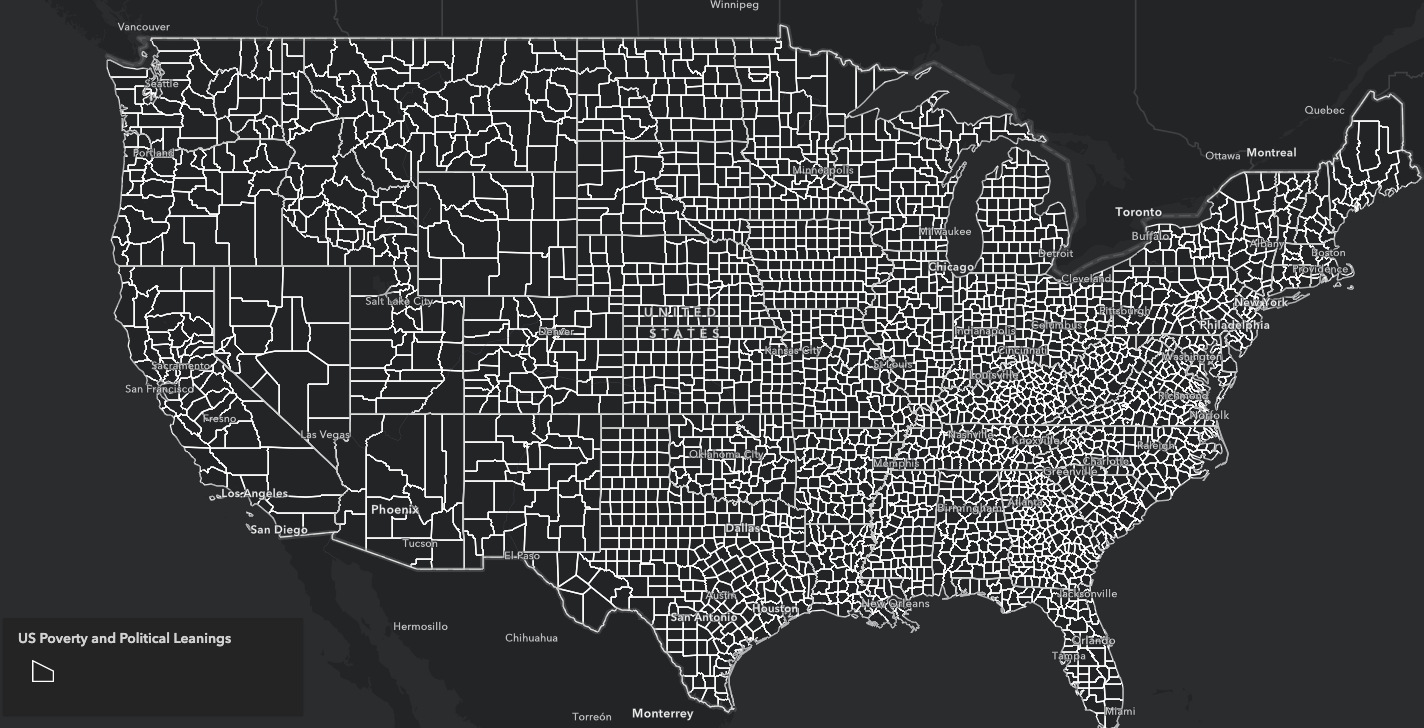
Please don’t do this. :)
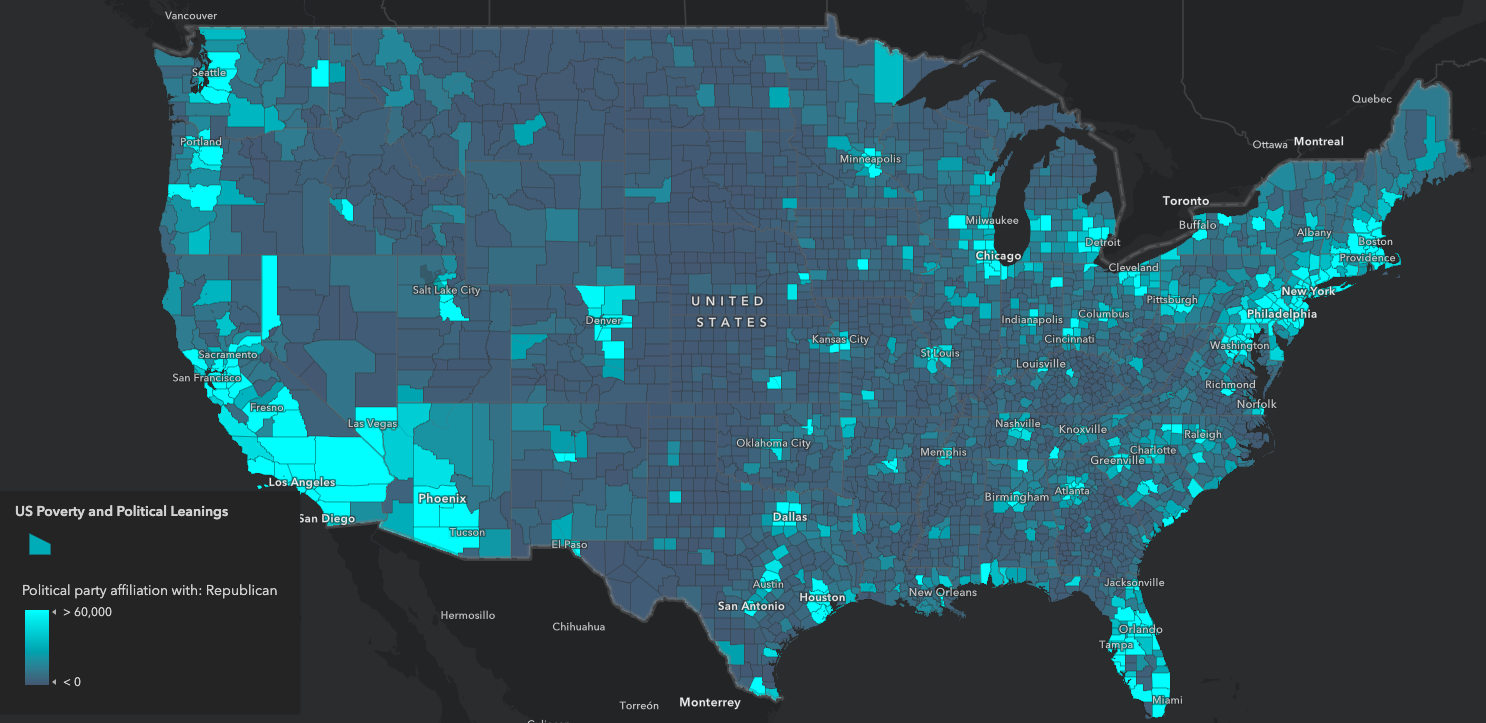
This displays normalized data along a continuous color ramp. Much better.
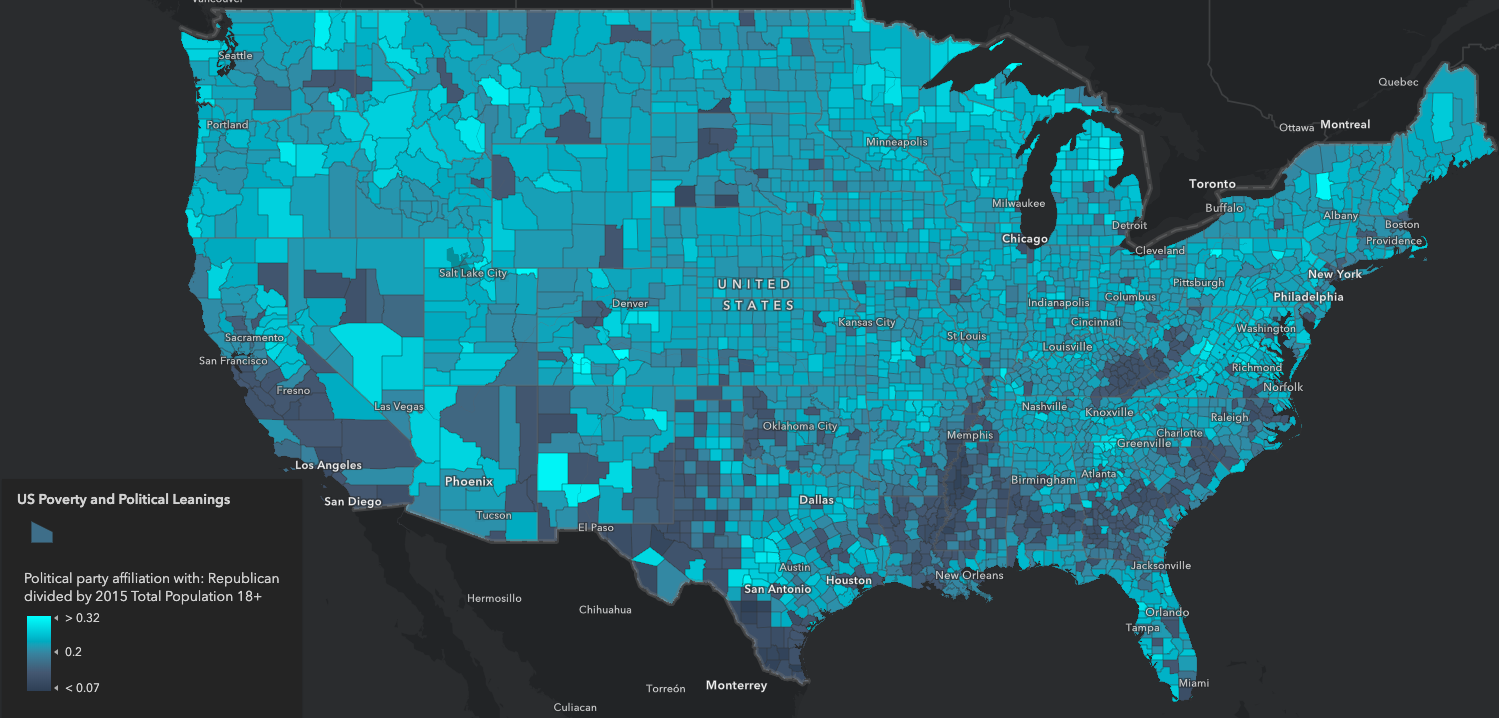
This displays normalized data along a continuous diverging color ramp. This uses an Arcade expression to make the data values true percentages. The legend is much improved and easier to understand.
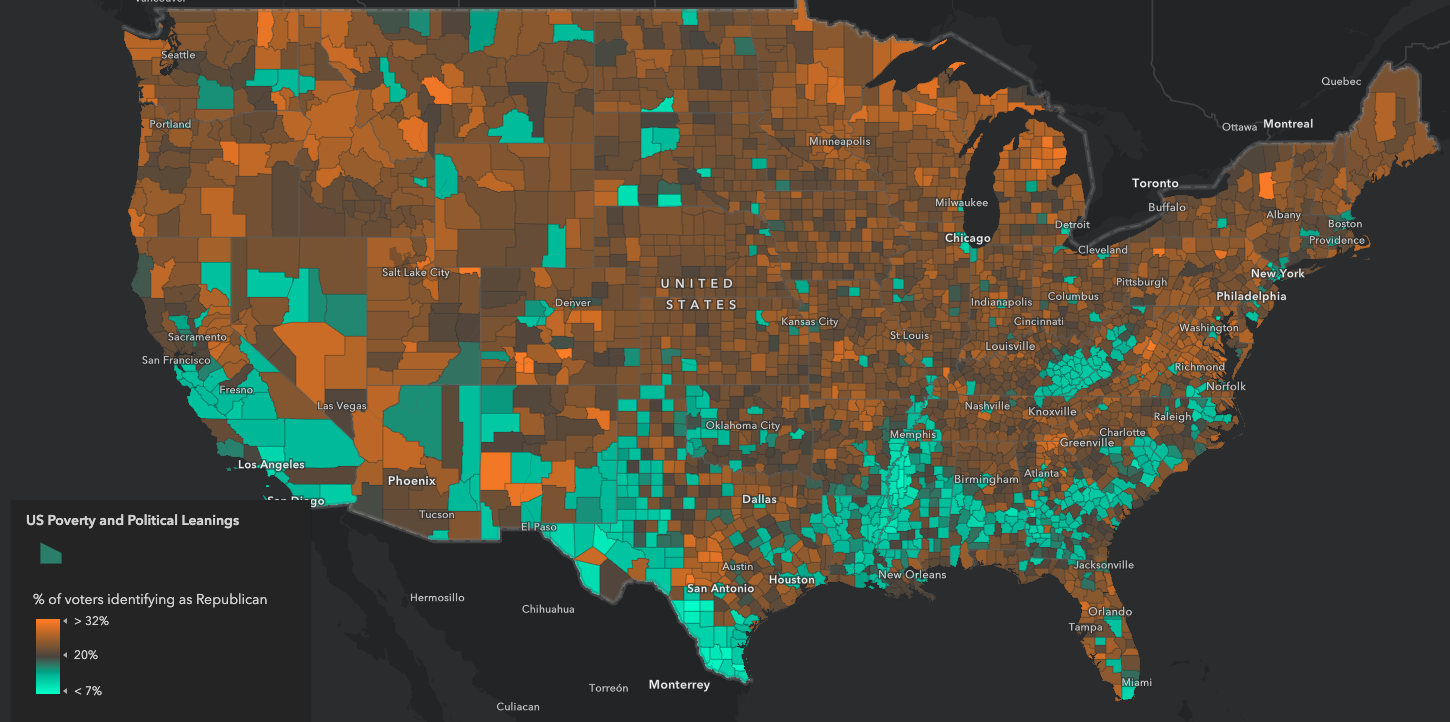
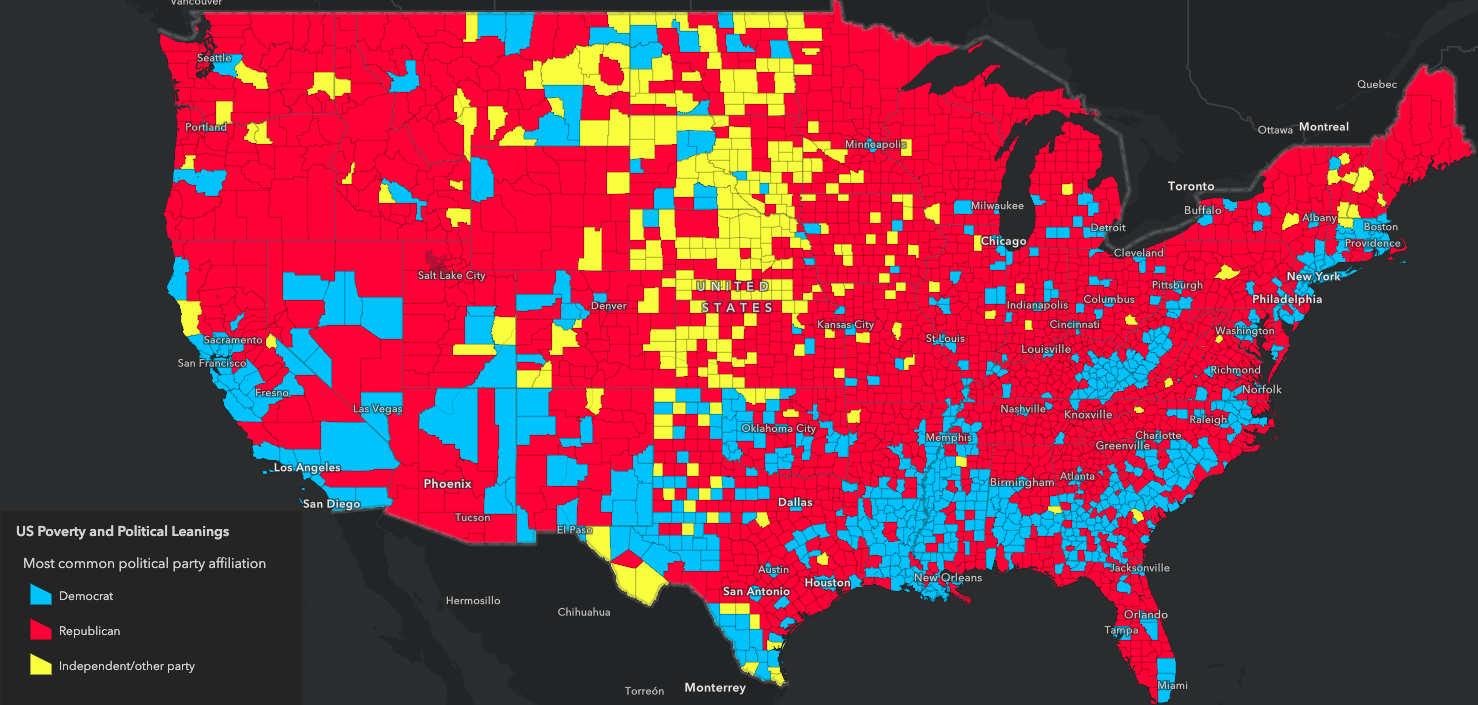
This visual shows how you can add create a simple predominance renderer using Arcade to show which of all competing numeric categories has the hightest value. Does the county have more Democrats, Republicans, or Independents?
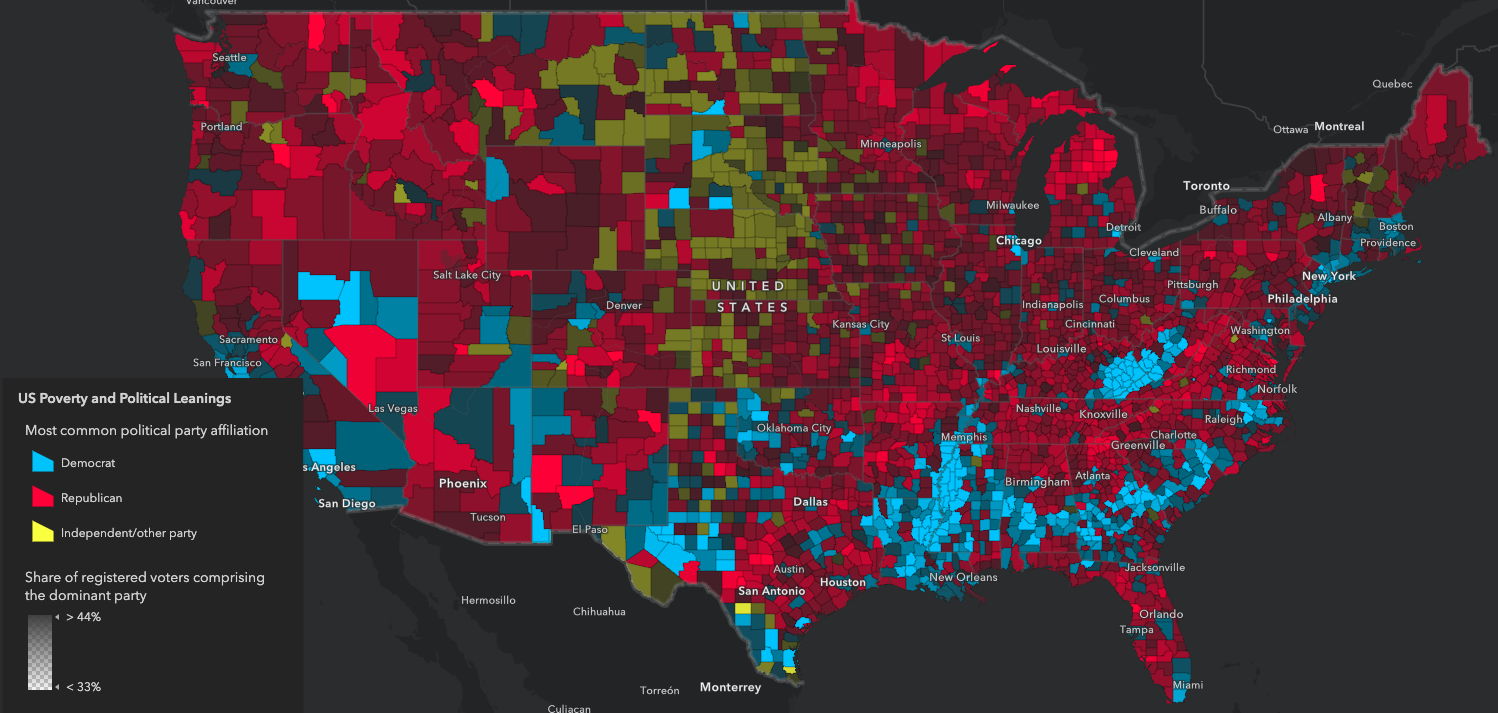
This map shows the same predominance renderer with an opacity visual variable to indicate the strength of the predominant value for each feature. The higher the opacity, the stronger the dominant value.
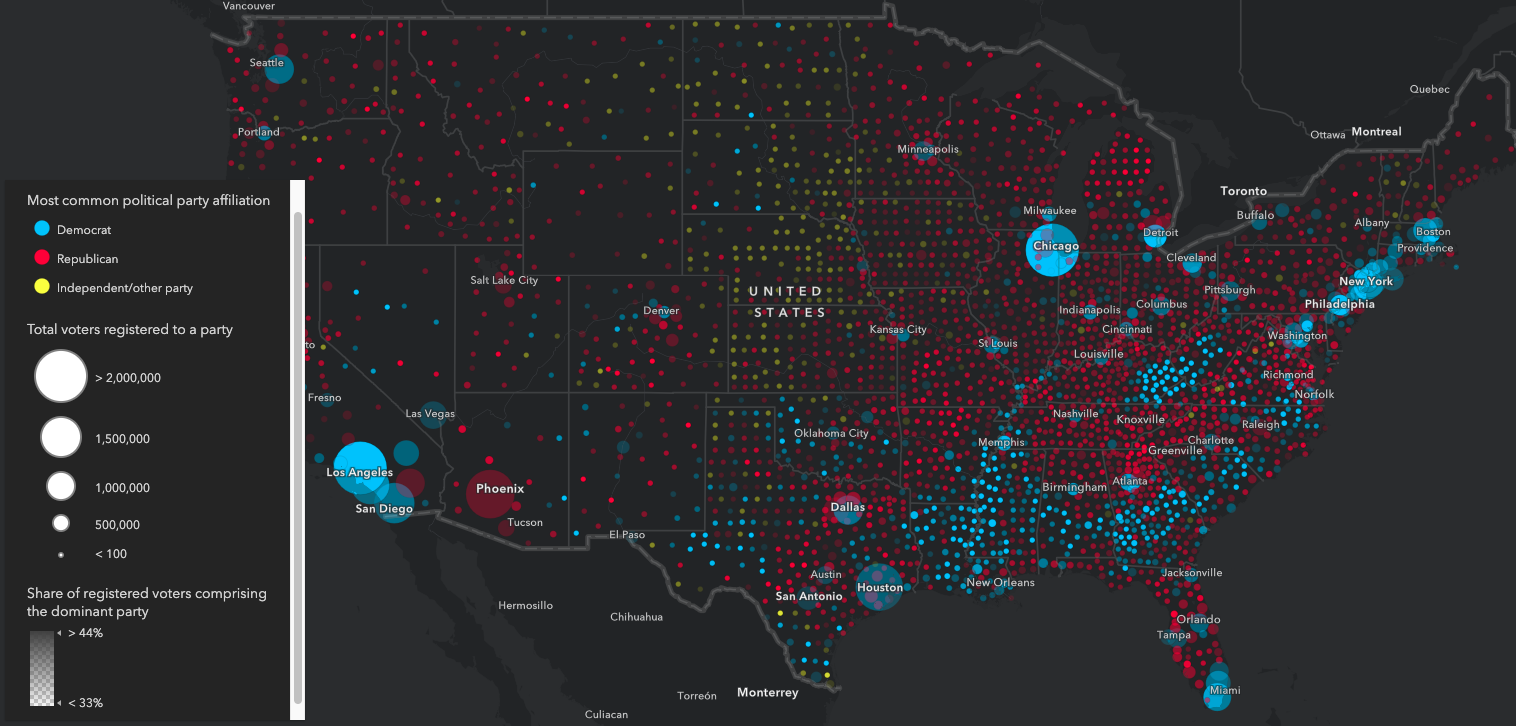
Predominance with opacity and size
This map adds a size variable to show the total count of the categories for each polygon. This removes the area problem introduced by choropleth maps and gives a better indication of which patterns really matter.
Webmap comparing totals of Republicans vs. Democrats vs. Independents
Smart Mapping
Smart mapping for data exploration
This sample demonstrates how to create a data exploration app using the Smart Mapping APIs. You can use the slider widgets to modify the visualization based on variables set by the developer.

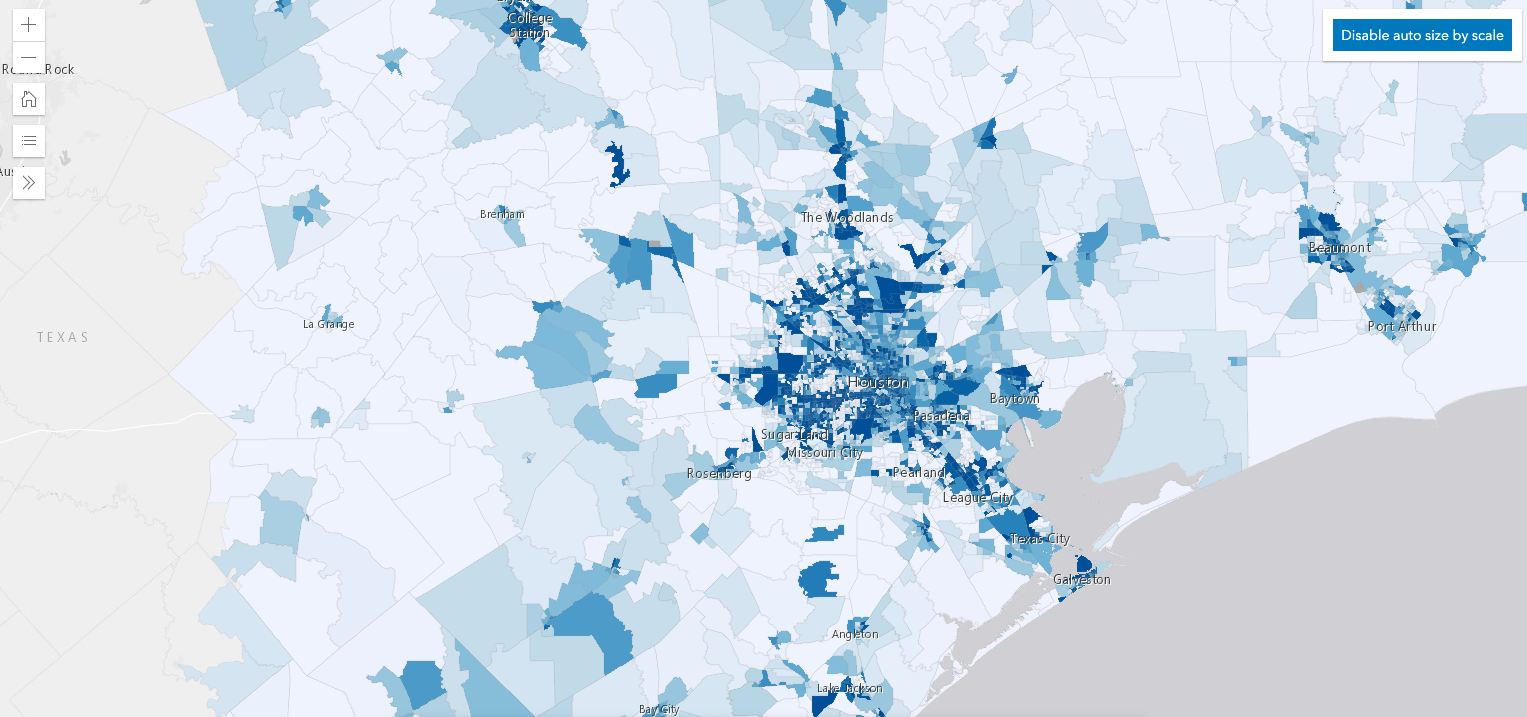
This sample demonstrates how to add a size variable for changing icon sizes by scale. Generally, icons should be larger as you zoom in and smaller as you zoom out. Read the accompanying blog How and why to adjust symbol size by scale in web maps for more details.
![]()
This sample demonstrates how to add a size variable for changing outline sizes by scale. Generally, outlines should be thicker as you zoom in and thinner as you zoom out. Read the accompanying blog How and why to adjust symbol size by scale in web maps for more details.
This sample displays all the sliders available in the JS API available for exploring your data and changing the visualization of your layers.
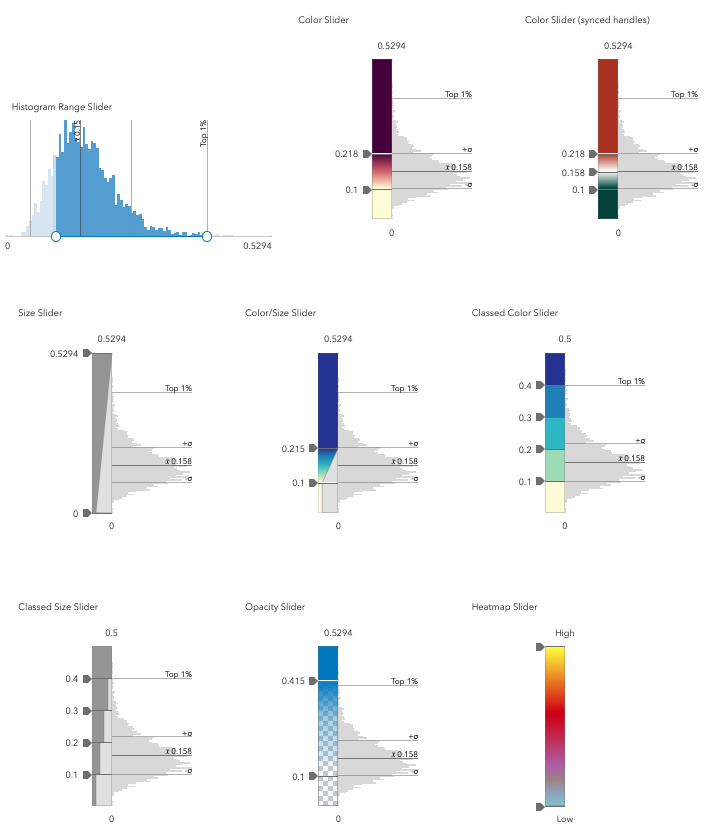 )
)
Clustering
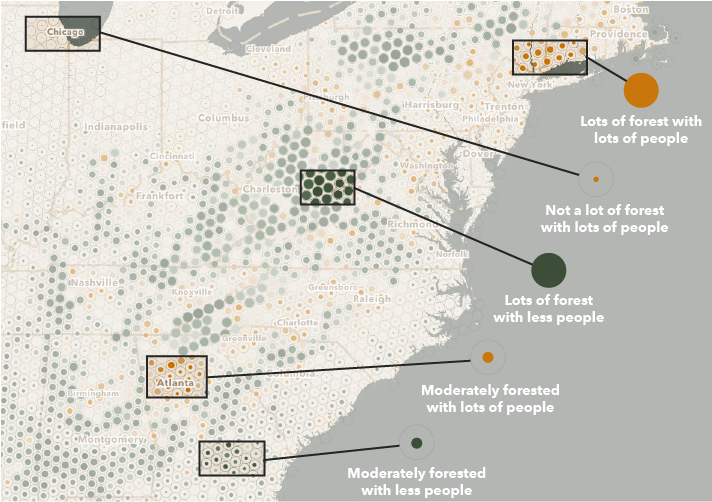
Dot Density
Dot Density - Housing growth animation
Fast updates
Colored histogram on ColorSlider
WebStyleSymbol
WebStyleSymbol proportionally sized
CIM Symbols
Resources
Issues
Find a bug or want to request a new feature? Please let us know by submitting an issue.
Contributing
Esri welcomes contributions from anyone and everyone. Please see our guidelines for contributing.
Licensing
Copyright 2020 Esri
Licensed under the Apache License, Version 2.0 (the “License”); you may not use this file except in compliance with the License. You may obtain a copy of the License at
http://www.apache.org/licenses/LICENSE-2.0
Unless required by applicable law or agreed to in writing, software distributed under the License is distributed on an “AS IS” BASIS, WITHOUT WARRANTIES OR CONDITIONS OF ANY KIND, either express or implied. See the License for the specific language governing permissions and limitations under the License.
A copy of the license is available in the repository’s license.txt file.