conferences
ArcGIS API for JavaScript: Using Arcade with Your Apps
length: 60 min
presenters: Kristian Ekenes, MohanRaj Balumuri
Mar. 7, 2019 2:30 p.m. - 3:30 p.m. Prerecorded and presented on YouTube.
Palm Springs Convention Center, Pasadena/Sierra/Ventura
Summary
Sometimes simple calculations can provide more insight than field values when creating data-driven visualizations. Arcade is a scripting language that allows you to drive visualizations, popup content, and labels by a value returned from an expression rather than a field value. This session will provide an overview of how to navigate the Arcade documentation while highlighting some of the key functions available in Arcade and the ArcGIS API for JavaScript. View examples of writing and debugging Arcade expressions for creating visualizations and labels for a FeatureLayer.
Presentation
Watch the video presentation.

Slides
Demos
Playground
The playground allows you to choose an Arcade profile and experiment with any expression with test data.
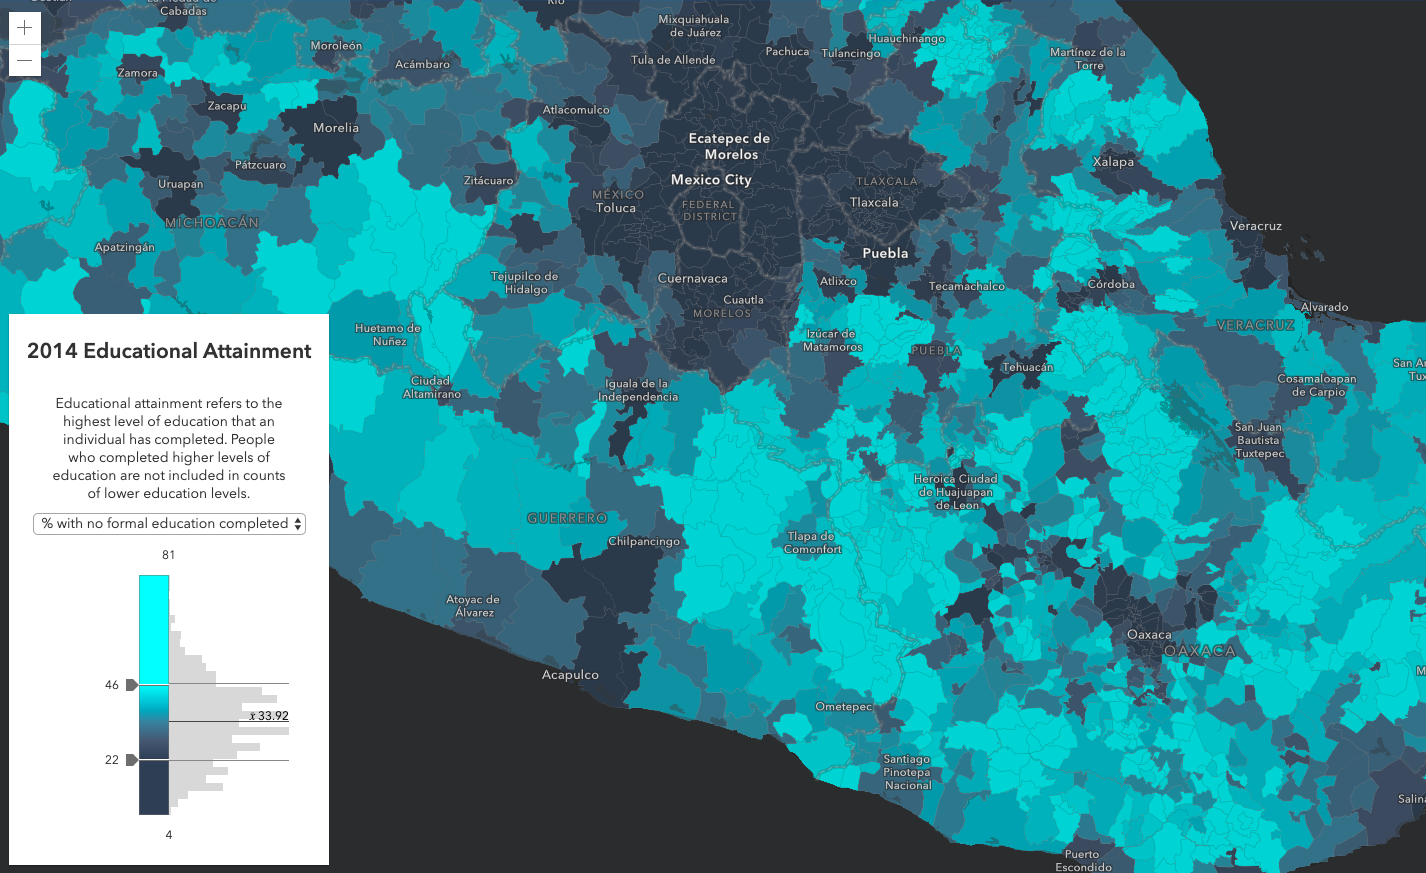
ArcGIS Online
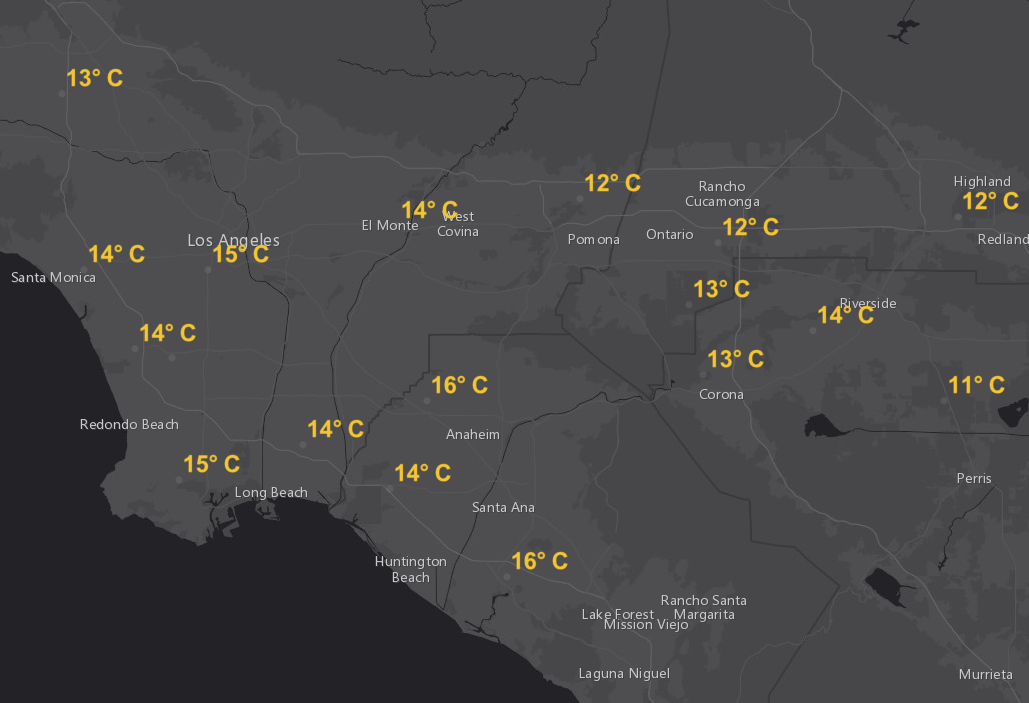
- Normalization/Rounding (% population that didn’t go to school)
- Calculating new values (% population that went to college)
- Predominant value (color) + strength of win (opacity)
Labels
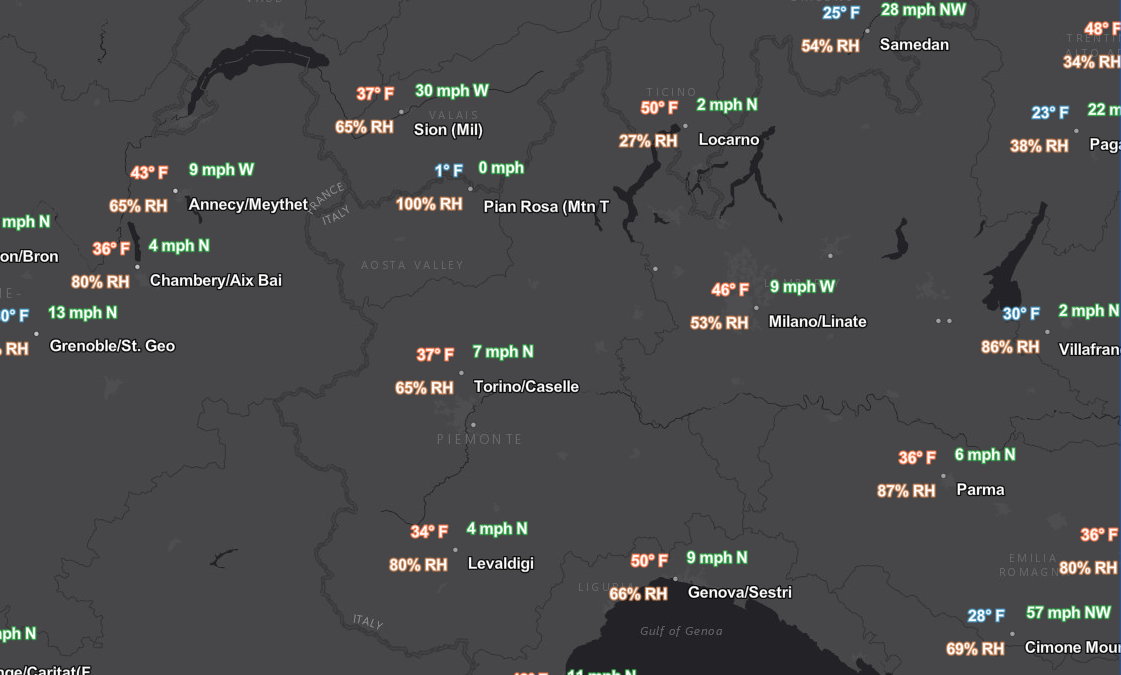
Converts temperature values from Fahrenheit to Celsius and displays the result as nicely formated labels for weather stations.
This app demonstrates how to use Arcade in simple and complex labeling expressions. As of the time of this presentation, the labeling profile is supported only in the 3.x versions of the ArcGIS API for JavaScript.
The calculation for determining wind direction (N/S/E/W) is done using a field that contains the compass direction of the wind (0-360).
Other Labeling examples in the web map above:
- % population that didn’t report education
- Predominant gap (label)
Visualization
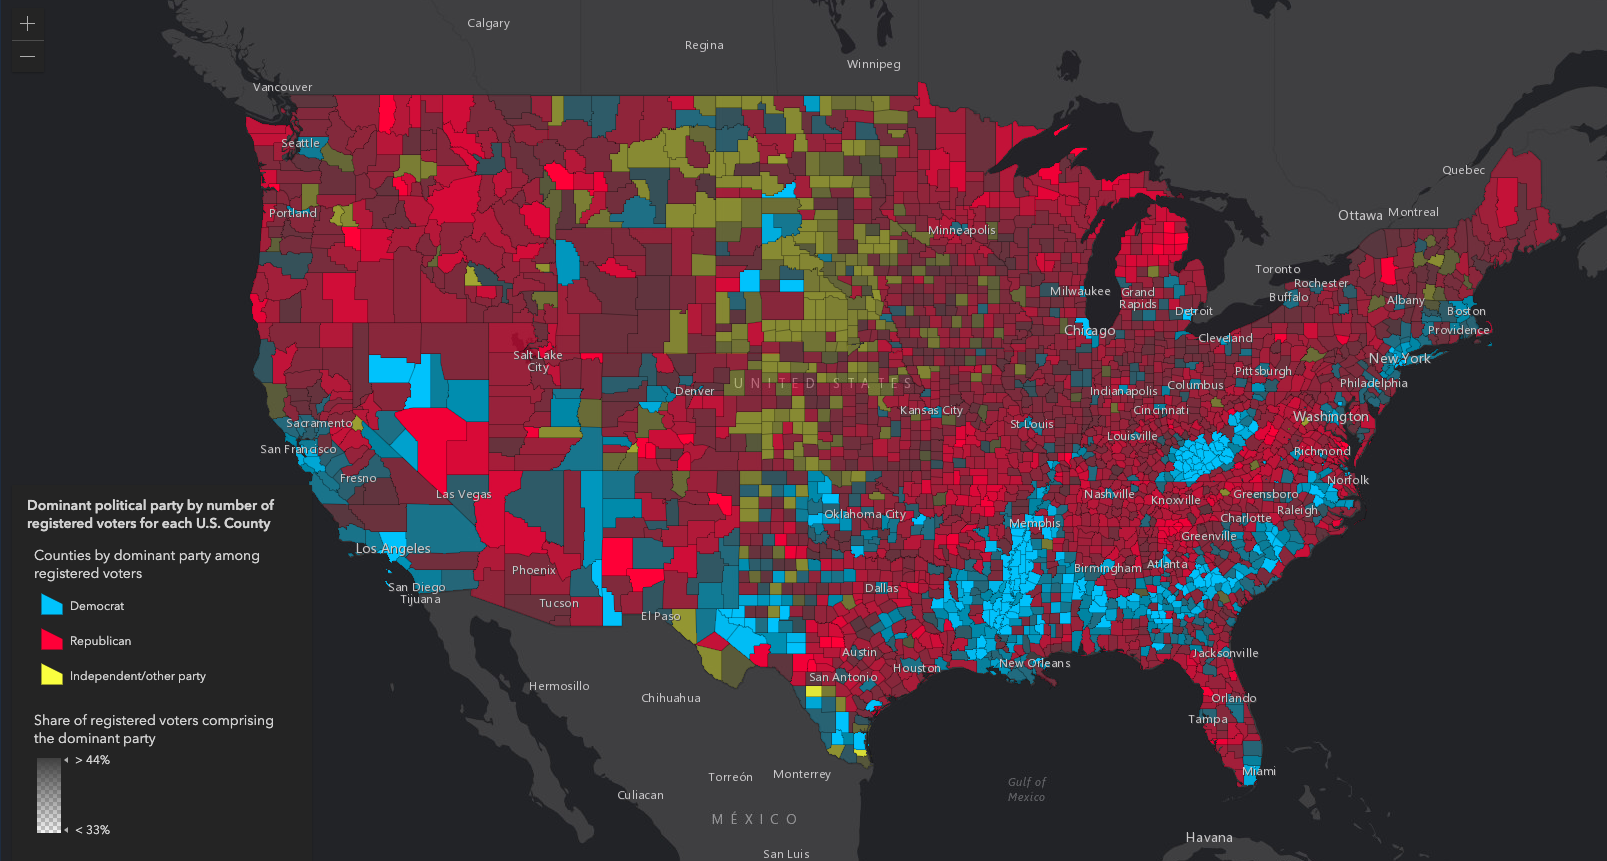
This app visualizes the predominant political party among registered voters in the county level across the United States. The Decode() function of Arcade matches the maximum count of all relevant fields to a string value representing the respective party. This prevents the user or GIS analyst from unnecessarily preforming a series of field calculations in new fields. If the expression is incorrect in any way, it is relatively simple to fix the script as opposed to recalculating fields. Also note that an Arcade expression is used to drive opacity. More opaque features represent counties where the predominant political party is relatively strong. Transparent counties indicate the predominant party barely edges the rival parties based on total count.
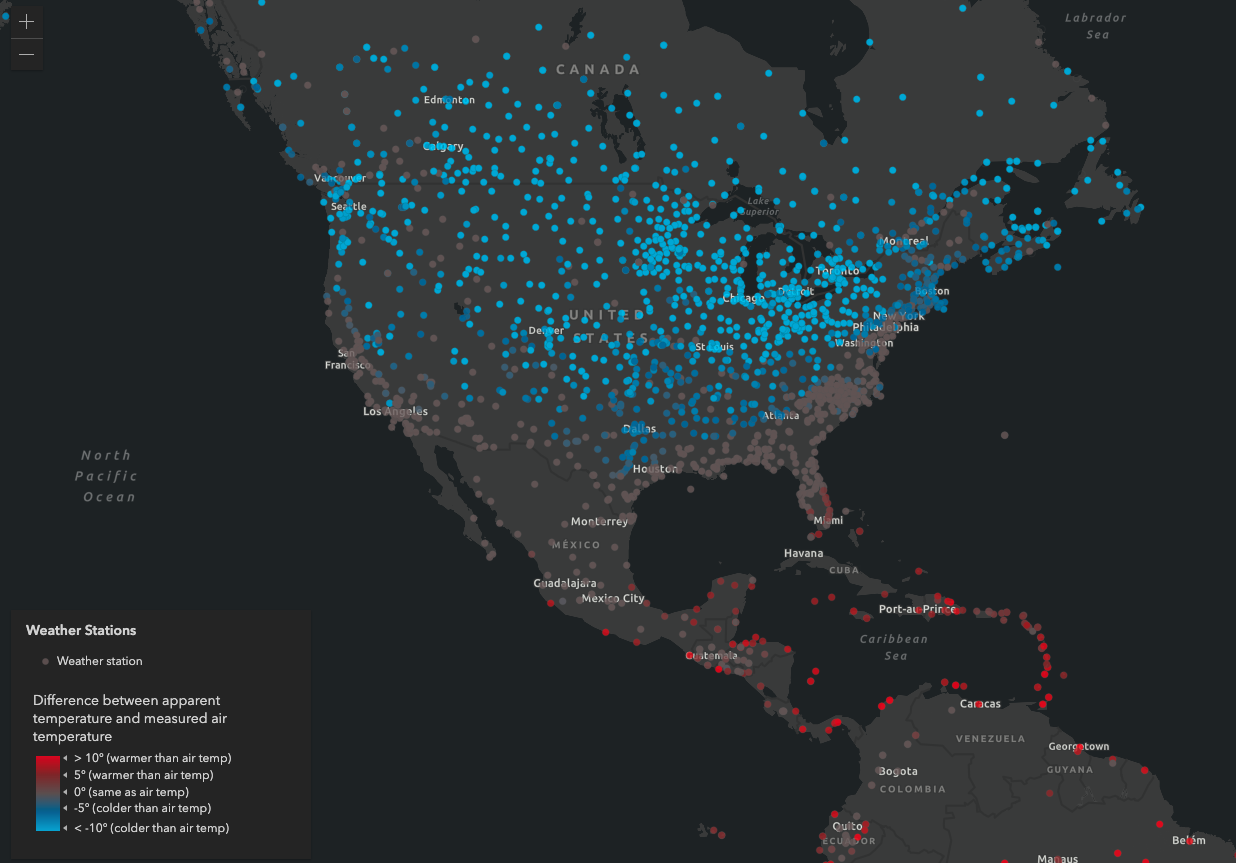
This sample shows how to use Arcade for performing larger calculations and logicial tests. In this case, wind chill and heat index are calculated based on other field values that are potentially updated very frequently. The math operations aren’t very complex, but you can use Arcade to automatically create pseudo-fields such as “Apparent temperature” to display calculated data based on fields that are frequently updated, such as weather data.
This sample demonstrates how to use the date functions and time offsets to render data based on the local time in the time zone in which the event occurred. In this case we render earthquakes from the last month based on whether or not they occurred in the morning or evening in the local time of the event.
Popups
Reference Arcade expressions in PopupTemplate
This sample demonstrates how to display values returned from an Arcade expression in a PopupTemplate defined on a FeatureLayer. Arcade is useful for creating visualizations in a FeatureLayer based on a value calculated from an expression executed on the client. PopupTemplates can reference the same expressions used in renderers to effectively communicate the data-driven visualization.
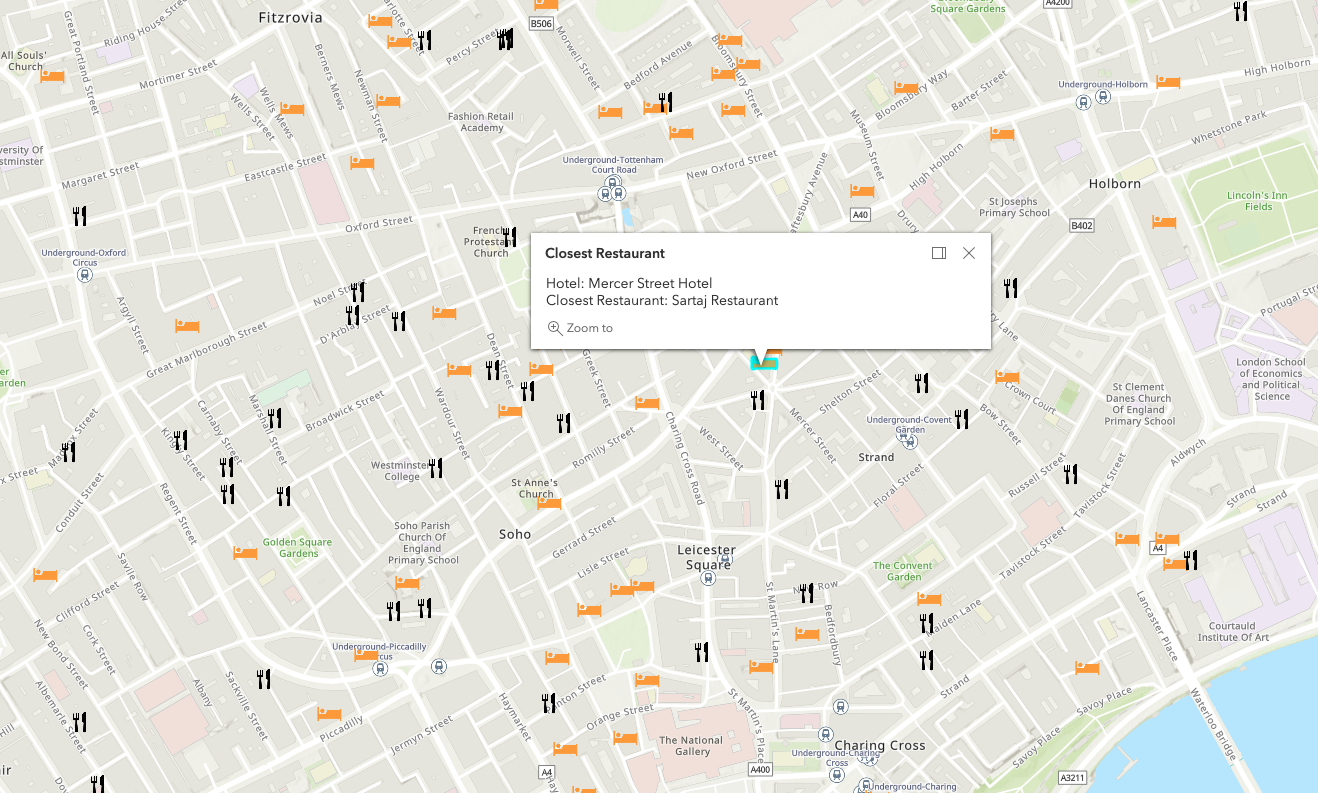
When a hotel point is clicked, the popup displays information about the closest restaurant to the hotel. The Arcade expression in the popup queries and finds the closest restaurant from another layer.
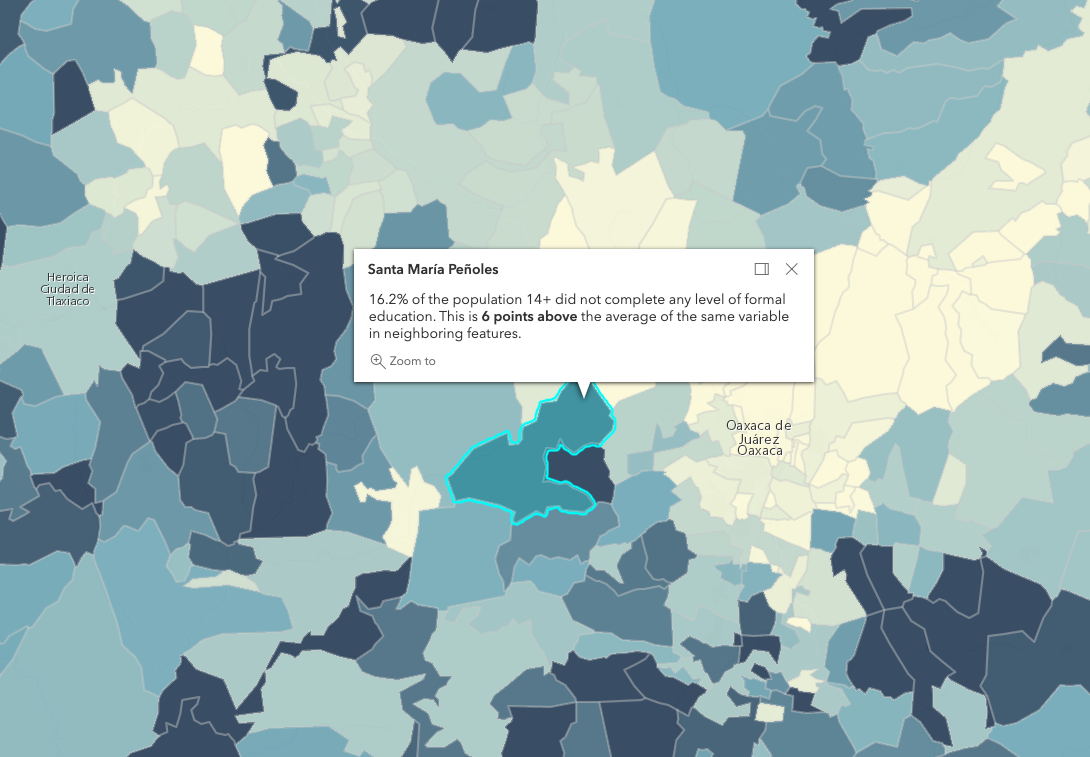
The popup uses an Arcade expression to compare an attribute value for the clicked/highlighted feature to the same value of all of its neighbors (the polygons that share a boundary with it). This is possible using Arcade feature sets in conjunction with the geometry engine.
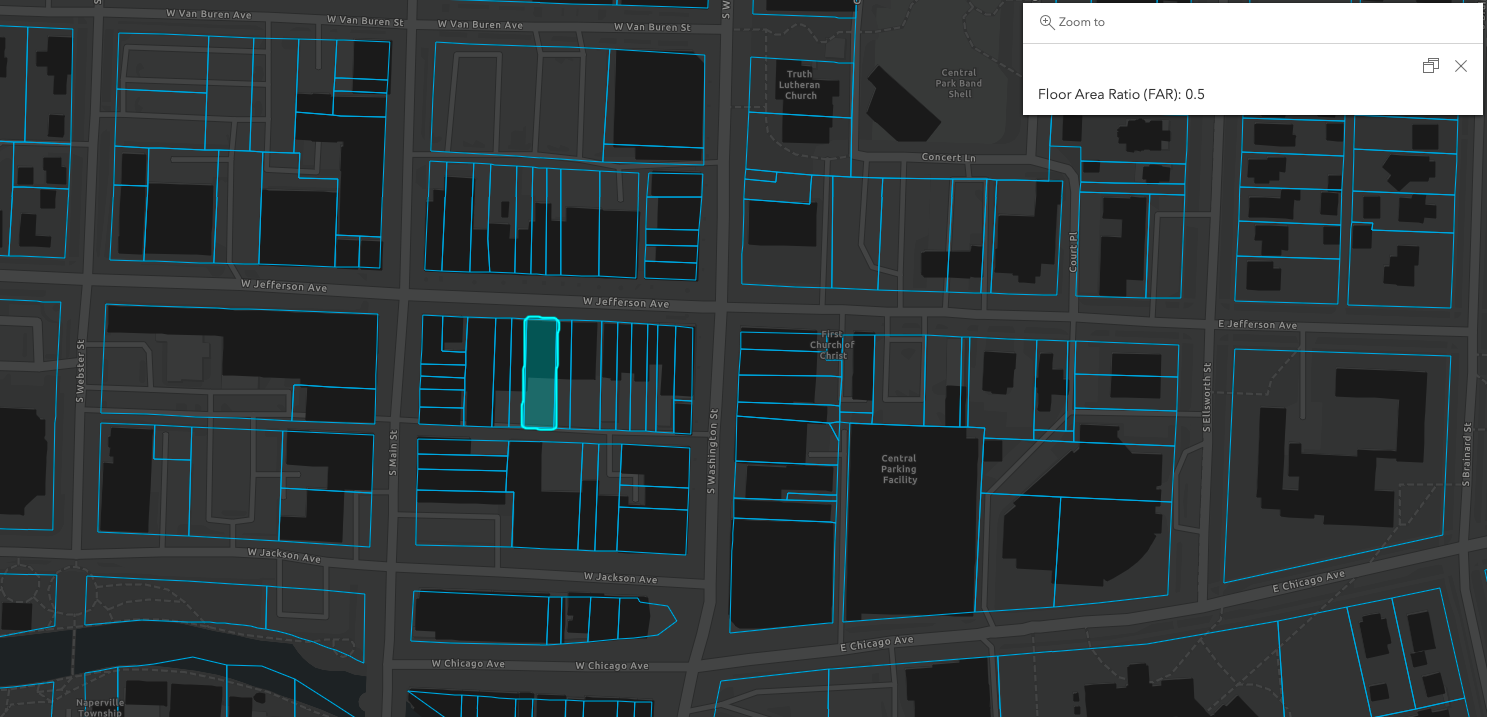
The popup in this sample calculates the ratio of the floor area of buildings within a parcel to the area of the parcel. It demonstrates how to calculate geometric intersections for cases where buildings may overlap multiple parcels.
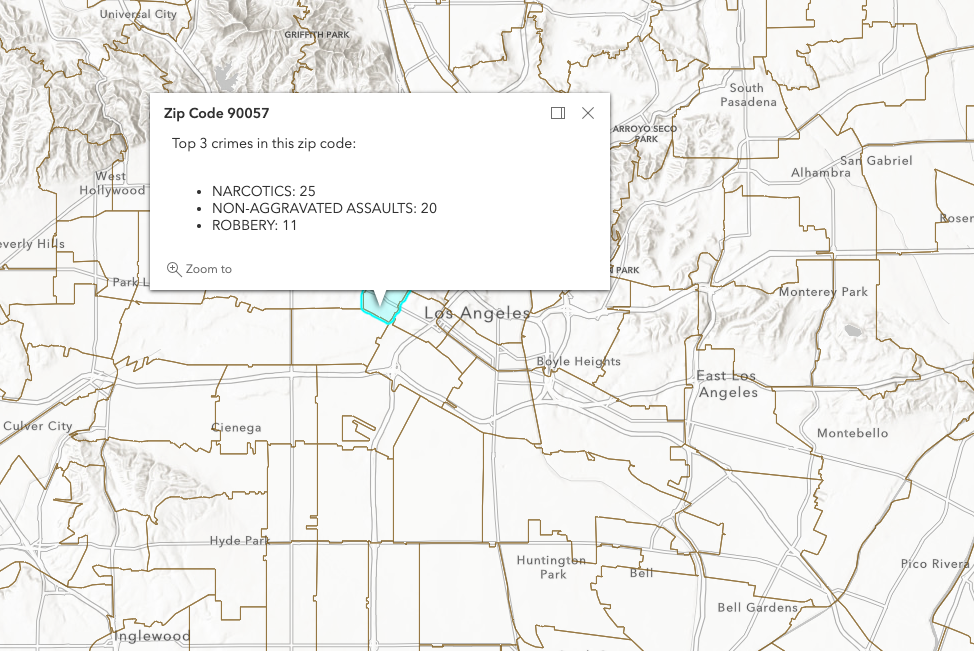
Presents a polygon layer that queries a point layer of crimes and lists the top 3 types of crimes in the popup.
Z Values
Renders earthquakes at their real-world depth based on an attribute value.
This sample shows how to change the elevation information of a 2D FeatureLayer for 3D visualization. Various options are available to customize the elevation of features in a 3D scene by modifying the elevationInfo property of a FeatureLayer.
An Arcade expression can be used to offset the elevation of features from the surface in a 3D app.
Dynamic Arcade - Examples of generated scripts
Generate Arcade Expressions for Smart Mapping
Demonstrates how to generate arcade expressions based on user input and handle field aggregation and normalization for them without constructing complicated UIs.
Explore data from a dynamic workspace
This sample demonstrates how to use the Smart Mapping renderer creators to generate a renderer for a Sublayer created from a dynamic data layer. The dynamic layer joins ancestry data from a table in a dynamic workspace to a map service layer. Select elements are provided to the user, allowing him/her to dynamically change the renderer based on different ancestry variables and classification methods.
This app demonstrates the predominance style in smart mapping, which generates Arcade in behalf of developers and users for visualization purposes. It also demonstrates how you can create your own functions for generating expressions dynamically in behalf of users.