conferences
2020 Dev Summit Plenary
One Ocean
Presentation
Watch the video presentation.

Summary
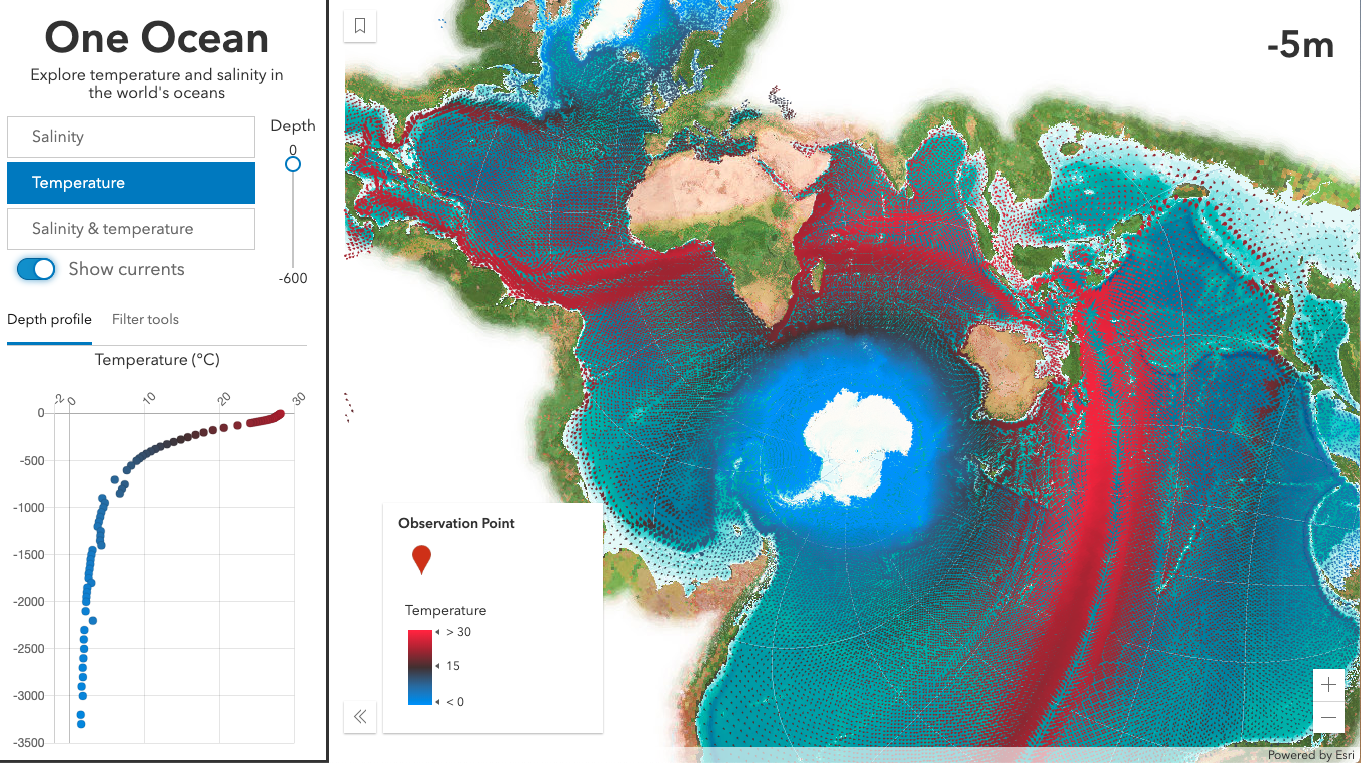
This app loads a subset of Esri’s open Ecological Marine Unit data as points, and renders them in the Spilhaus projection.
Once the data loads, you can explore how temperature or salinity varies throughout the oceans by planar coordinates and depth. Hover over a point to see how salinity or temperature varies by depth for a specific location. Use the depth slider to update the renderer for the selected depth value.
This updates the reference to the field (i.e. column) for the specified attribute at the depth level indicated by the slider. The renderer updates smoothly without having to reprocess geometries.
Switch on “Show currents” to see how the velocity and direction of ocean currents varies across depth throughout the world.
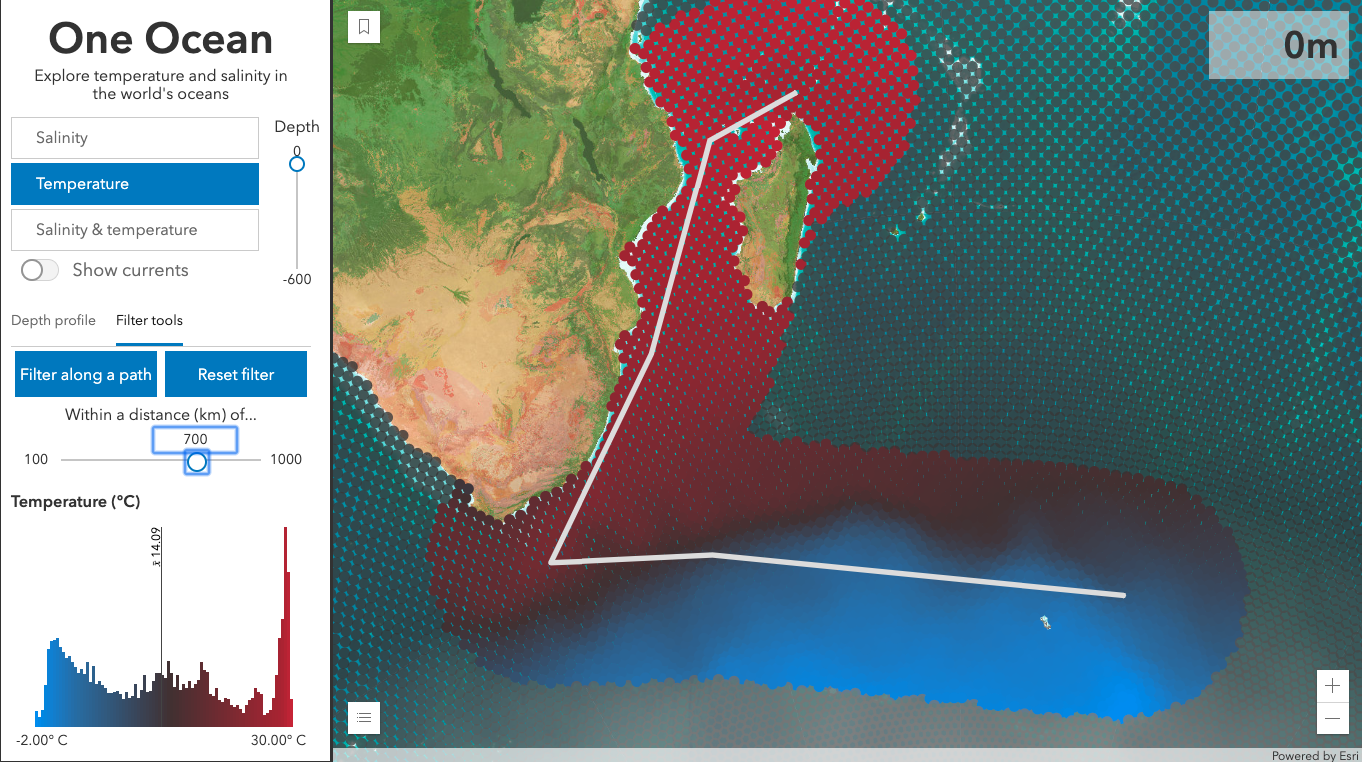
You can also filter data within a distance of a line and summarize it in a histogram with the “Filter along a path” button in the “Filter tools” tab.
This app loads 280 MB of compressed data, so a modern desktop browser is required to view this application.
Relevant Code
Every time the user changes the renderer with the depth slider or the buttons for selecting a variable, the renderer updates the following way:
// Color ramp presets for each variable

const variableConfig = {
  salinity: {
    colors: [ "#fee6ce", "#fdae6b", "#e6550d" ],
    chartOptions: {
      min: 32,
      max: 40
    },
    stops: [
      { value: 33.0, color: "#fee6ce" },
      { value: 35.0, color: "#fdae6b" },
      { value: 36.4, color: "#e6550d" }
    ]
  },
  temp: {
    colors: [ "#1993ff", "#2e6ca4", "#403031", "#a6242e", "#ff2638" ],
    chartOptions: {
      min: -2,
      max: 30
    },
    stops: [
      { value: 0, color: "#1993ff" },
      { value: 5, color: "#2e6ca4" },
      { value: 15, color: "#403031" },
      { value: 27, color: "#a6242e" },
      { value: 30, color: "#ff2638" }
    ]
  }
};

function updateCurrentsRenderer(){

  // Either temperature or salinity for the depth value indicated by the slider
  const variableField = `${variable}_${getLevelFromDepth(depthSlider.values[0])}`;

  // These fields are used when "Show currents" is selected
  const velocityField = `Velocity_${getLevelFromDepth(depthSlider.values[0])}`;
  const directionField = `Direction_${getLevelFromDepth(depthSlider.values[0])}`;

  // Not all points have valid data. This filters out points that don't have
  // data for a given location and depth
  emuLayerView.filter = {
    where: `${variableField} IS NOT NULL AND ${velocityField} IS NOT NULL AND ${directionField} IS NOT NULL`
  };

  emuLayer.renderer = {
    type: "simple",
    // Symbol resembles a drop of water
    symbol: {
      type: "web-style",
      name: "tear-pin-1",
      styleName: "Esri2DPointSymbolsStyle"
    },
    visualVariables: [{
      type: "color",
      legendOptions: {
        title: variable === "salinity" ? "Salinity" : "Temperature",
        showLegend: true
      },
      // temp_1, temp_2, temp_3, etc
      field: variableField,
      stops: variableConfig[variable].stops
    }, {
      type: "size",
      legendOptions: {
        showLegend: false
      },
      // Velocity_1, Velocity_2, Velocity_3, etc
      field: velocityField,
      minDataValue: 0,
      maxDataValue: 0.5,
      // minSize depends on the scale value. Icons
      // grow in size as you zoom in.
      minSize: {
        type: "size",
        valueExpression: "$view.scale",
        stops: [
          { value: 7812500, size: "12px" },
          { value: 15625000, size: "8px" },
          { value: 31250000, size: "6px" },
          { value: 62500000, size: "4px" },
          { value: 125000000, size: "2px" },
          { value: 250000000, size: "1px" }
        ]
      },
      // maxSize depends on the scale value. Icons
      // grow in size as you zoom in.
      maxSize: {
        type: "size",
        valueExpression: "$view.scale",
        stops: [
          { value: 7812500, size: "32px" },
          { value: 15625000, size: "20px" },
          { value: 31250000, size: "16px" },
          { value: 62500000, size: "12px" },
          { value: 125000000, size: "6px" },
          { value: 250000000, size: "4px" }
        ]
      }
    }, {
      type: "rotation",
      legendOptions: {
        showLegend: false
      },
      // Direction_1, Direction_2, Direction_3, etc
      field: directionField,
      rotationType: "geographic"
    }]
  };
}
Methods
Watch the video presentation below to learn more about the steps taken to create this app.

Credits
The app was developed by Kristian Ekenes under the direction of Jeremy Bartley. Keith VanGraafeiland provided the flat table of EMU data points at 1/4 degree resolution for all ocean depths. This data was later thinned to 1/2 degree resolution up to 3500m in depth. John Nelson designed and published the basemap tile layer.
I also want to thank Aurélie Albert, Jean Marc Molines, and Bernard Barnier from the Multiscale Ocean Modelling (MEOM) Group at Institut des Géosceinces de l’Environnement (IGE) in Grenoble for making available the DRAKKAR model of ocean currents.