conferences
2020 Dev Summit notes, slides, and demos
Navigate to the appropriate directory to view notes for the corresponding session described below.
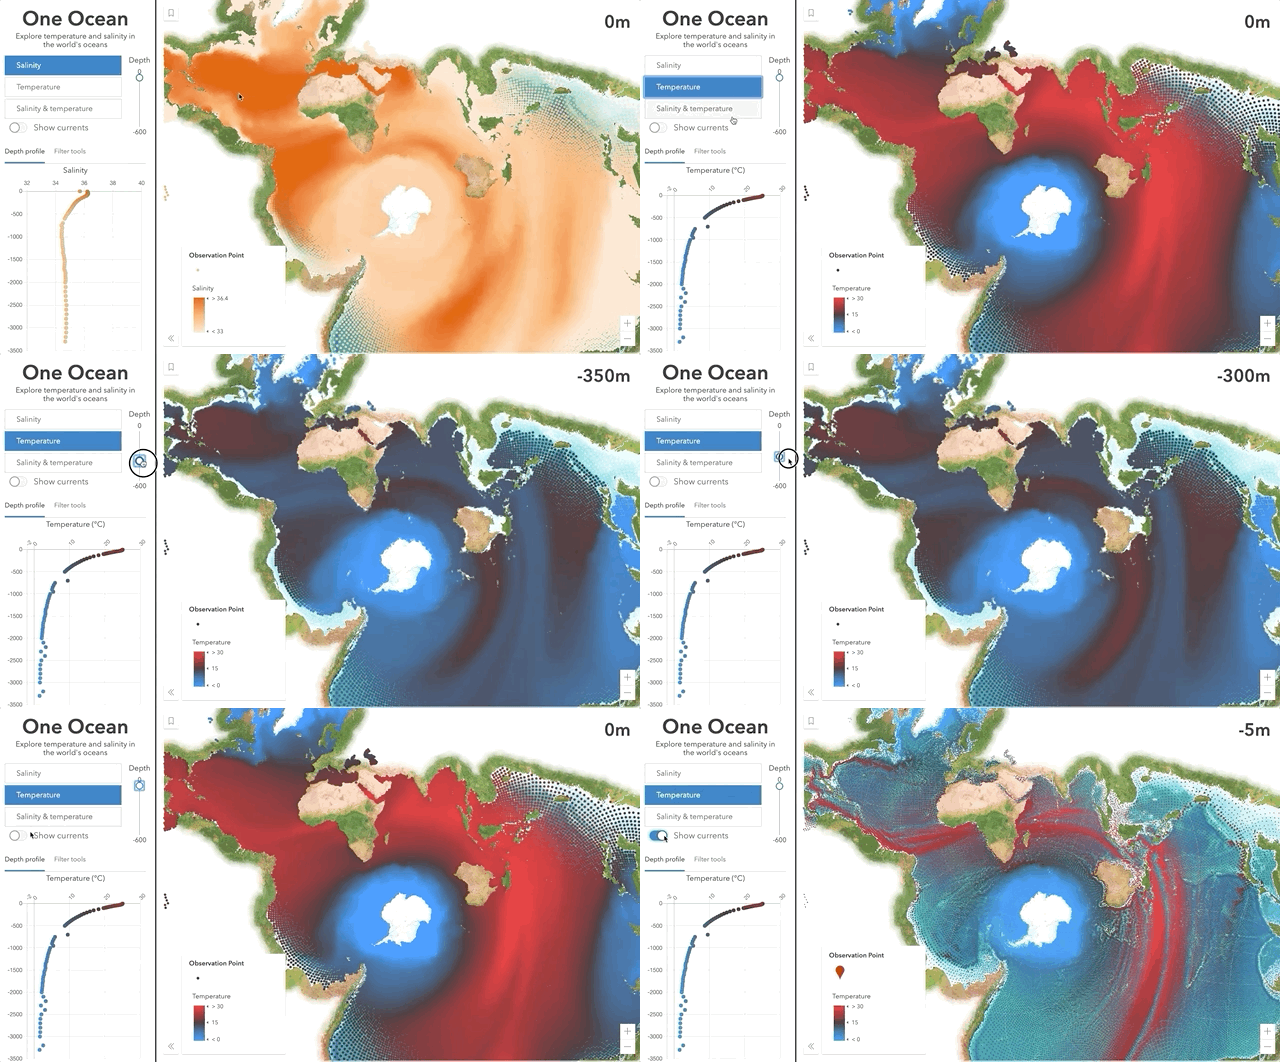
One Ocean
This page provides an overview for how to prep the data and write the code used to create the One Ocean app.
ArcGIS API for JavaScript: 2D Visualization
The ArcGIS API for JavaScript lets you build powerful interactive mapping applications. Learn how you can turn your raw data into information that tells a story with simple 2D data-driven visualizations. This session will provide an overview to the various visualization techniques available in the API specific to 2D vector data.
Best Practices for Building Web Apps that Visualize Large Datasets
Learn about the various technologies used behind the scenes by ArcGIS Online and the ArcGIS API for JavaScript that help you work with more features in the browser. We’ll demonstrate step-by-step how to optimize a large dataset for rendering and analysis in the browser starting with data preparation, feature service settings, and visualization techniques in the ArcGIS API for JavaScript that will allow your users to work with more data more efficiently in your web apps. We hope to have you walk away inspired with innovative ways to do the same in your apps.
ArcGIS API for JavaScript: Using Arcade with Your Apps
Sometimes simple calculations can provide more insight than field values when creating data-driven visualizations. Arcade is a scripting language that allows you to drive visualizations, popup content, and labels by a value returned from an expression rather than a field value. This session will provide an overview of how to navigate the Arcade documentation while highlighting some of the key functions available in Arcade and the ArcGIS API for JavaScript. View examples of how powerful Arcade can be when creating visualizations and labels for a FeatureLayer. Also, observe how the live Arcade editor in ArcGIS Online can be a powerful tool in helping you write, edit, debug, and execute custom expressions.
Practical Guide for Building a 3D Web App From 2D Data
Have you hesitated to build 3D apps because they look complicated or you lack the necessary data? In this session, learn how to build a 3D app using your 2D data and the resources provided out of the box by Esri and the ArcGIS API for JavaScript. Even if your data doesn’t contain Z-values, you can build sophisticated 3D apps that leverage modern browser technology to render your 2D features with 3D symbology.
